Using Ask Zia
What is Ask Zia?
Ask Zia is a search-driven analytical assistant that helps you create reports instantly. You can ask questions in natural language and Ask Zia generates the most relevant reports as answers to you.
Using Ask Zia
You can easily invoke this by clicking the Ask Zia option on the left panel of your workspace. The Ask Zia screen will open.
Type your question in the search box provided. Ask Zia will interpret the question and will get the best possible report as an answer.
You can add more qualifiers to your question to have Ask Zia generate the most relevant insight for you.
Auto Suggestion
Ask Zia will keep learning from the patterns in your question and provides intelligent suggestions to assist you in drafting the question. These suggestions are highly personalized based on the relationship among the tables, previous history, Ask Zia customization etc.
The Auto Suggestion also helps users by suggesting supporting phrases like Top 10 / Bottom 10, sort options, chart types etc.,
You will also find a list of Recent Questions and Suggested Questions. You can easily generate reports by clicking these questions.
Generated Report
Ask Zia will understand the intent in your question, resolve ambiguities, and generates the most appropriate report that matches your question. The generated report will be displayed as a preview. The Preview screen displays a detailed description and report information on how the report is plotted. You can verify the report and save them.
Description
Ask Zia will automatically generate a detailed description and display it at the bottom.
This description lets you know how the data is grouped, the aggregate column used, function applied over them and filters used. The following color classification is used in the description.
- Blue - Metric Column
- Green - Function applied to the metric column
- Brown - Grouped by Columns
- Light Green - Date Function
- Light Brown - Column used to filter
- Sky Blue - Filtered values
- Pink - Negative filter negation
- Purple - Sorting applied
Report Information
On the right side of the preview, you will find the Report Information. This section list the facet of a report (X &Y Axes and Color for chart and Column, Row and Data for Pivot) and how the columns are used. You will also find details on filters applied over the report. 
Change Chart Type
When Ask Zia generates a chart, you can choose to change the type of chart. Follow the steps given below to do this.
- Click the Chart icon in the contextual menu on top of the Preview screen.
- Select the required chart type from the drop-down.
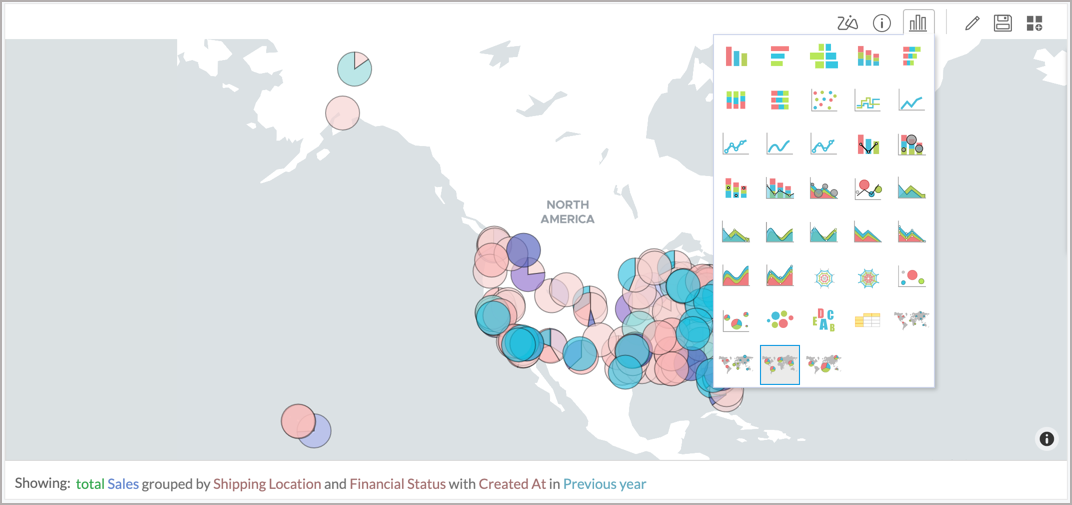
- Save the report.

Edit the Report
You can easily edit the report that Ask Zia generates. Follow the below steps to edit the report.
- Click the Edit icon in the contextual menu on top of the Preview screen.
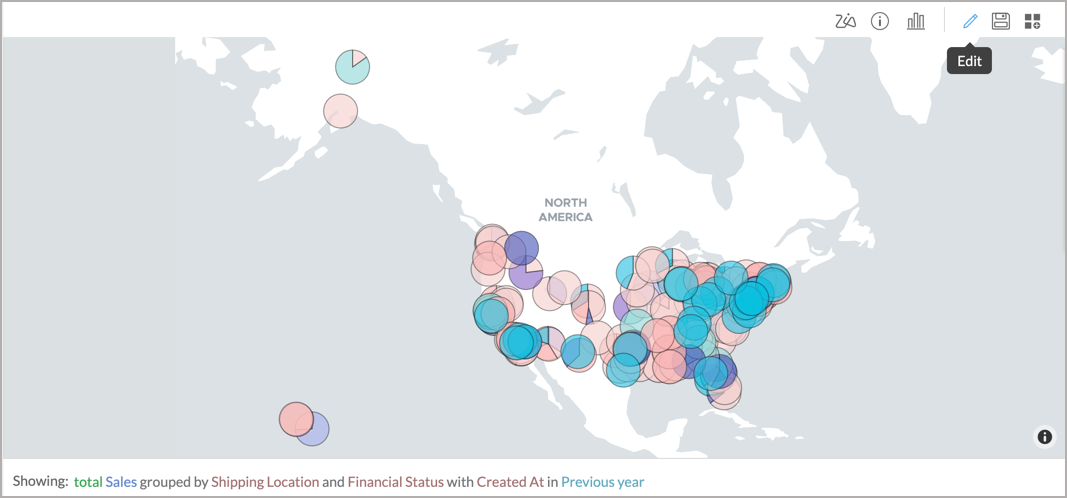
- This will open the report editor with the columns recommended by Ask Zia. You can modify them as needed.
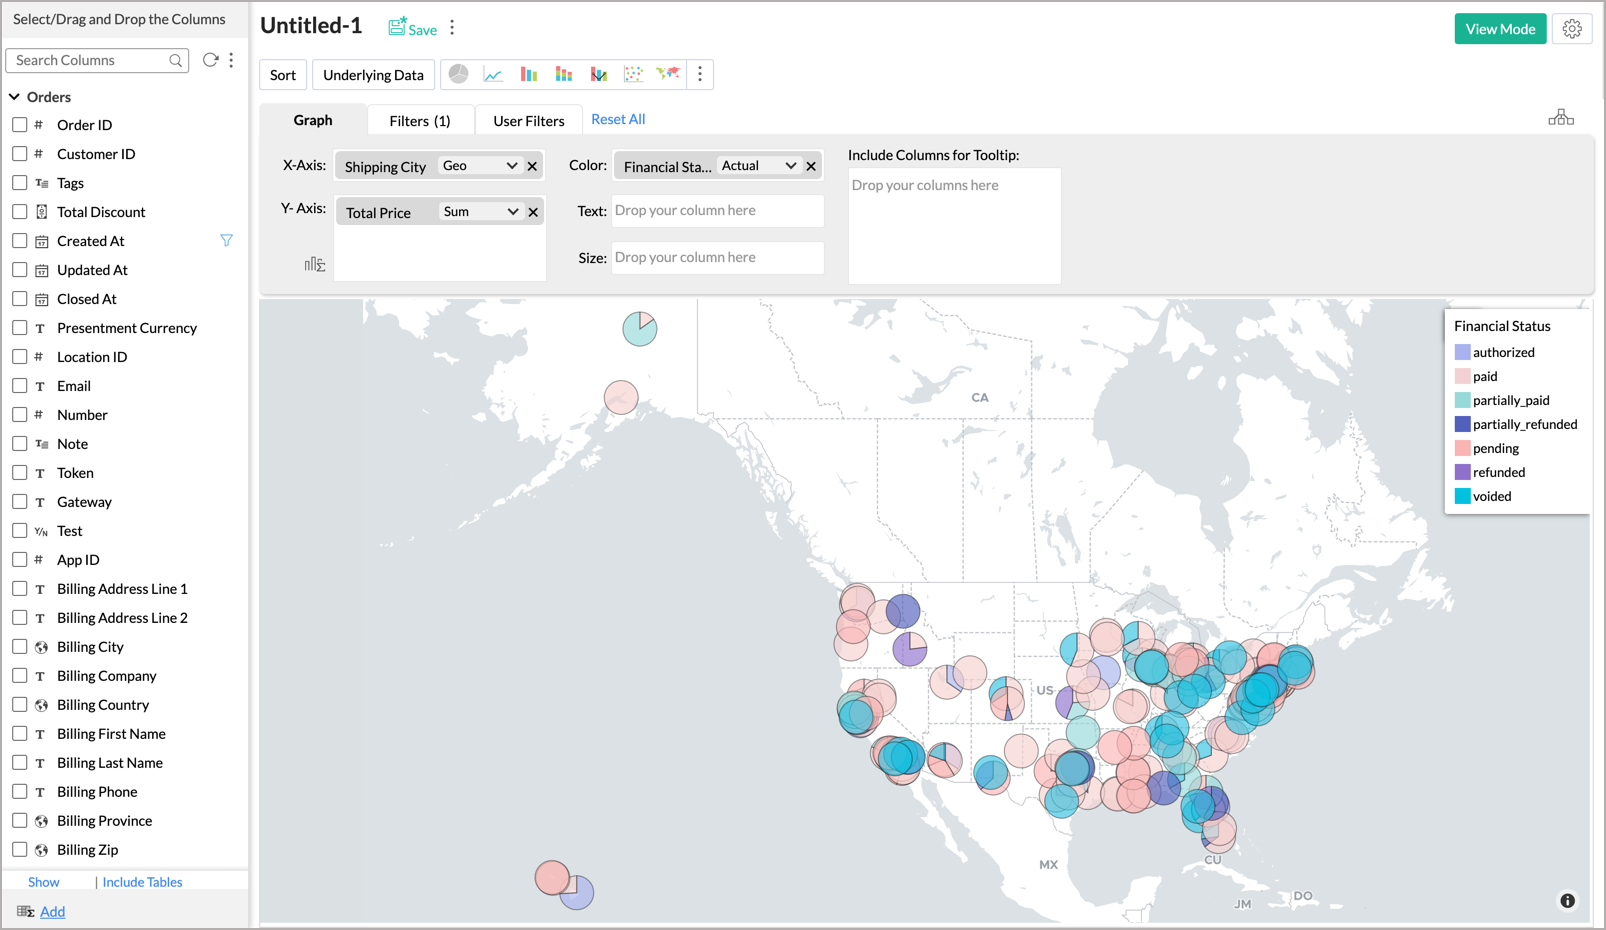
- Save the report.


Save Report
You can save the report permanently by following the below steps:
- Click the Save icon in the contextual menu on top of the Preview screen.
- The Save dialog will open. Specify the View name.
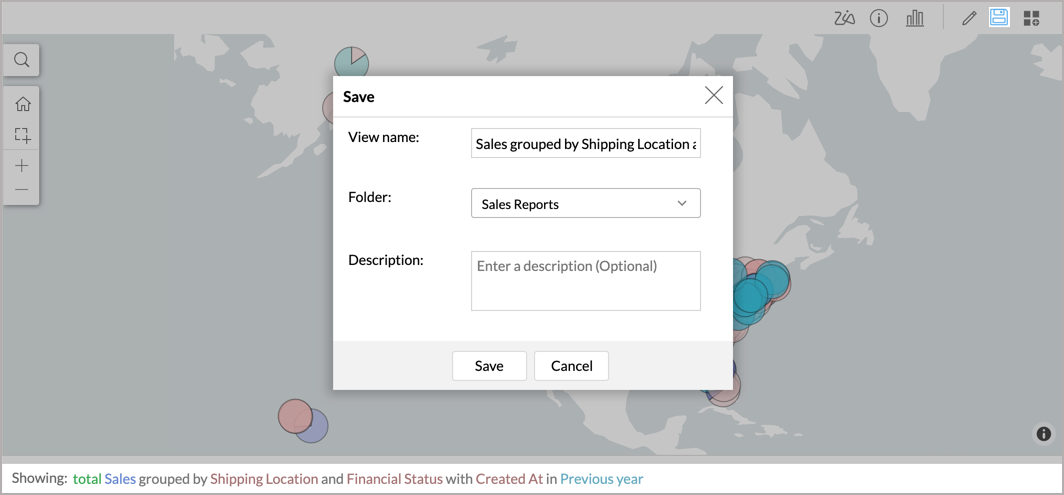
- Select the Folder to save the view.
- Click Save to save the report.

Add Report to Dashboard
You can also directly add the reports to a dashboard. Follow the below steps to add the report to a dashboard:
- Click the Dashboard icon in the contextual menu on top of the preview.
- The Save & Add to Dashboard dialog will open. Specify the View name.
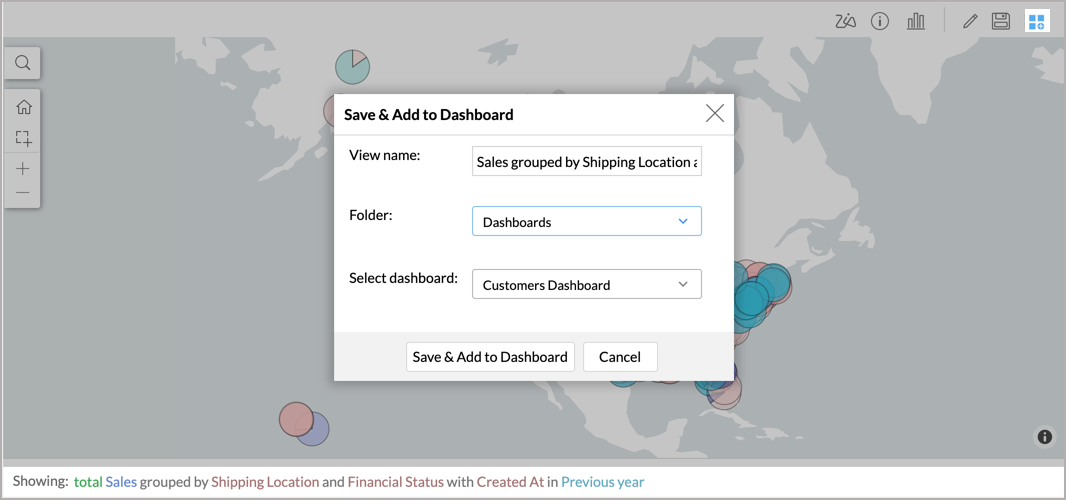
- Select the Folder to save the report before adding it to the dashboard.
- Select the dashboard in which you want to add the report.
- Click Save & Add to Dashboard to save the report and add it in the dashboard. The report will be added as the first view in the dashboard. You can realign the dashboard later as needed.
