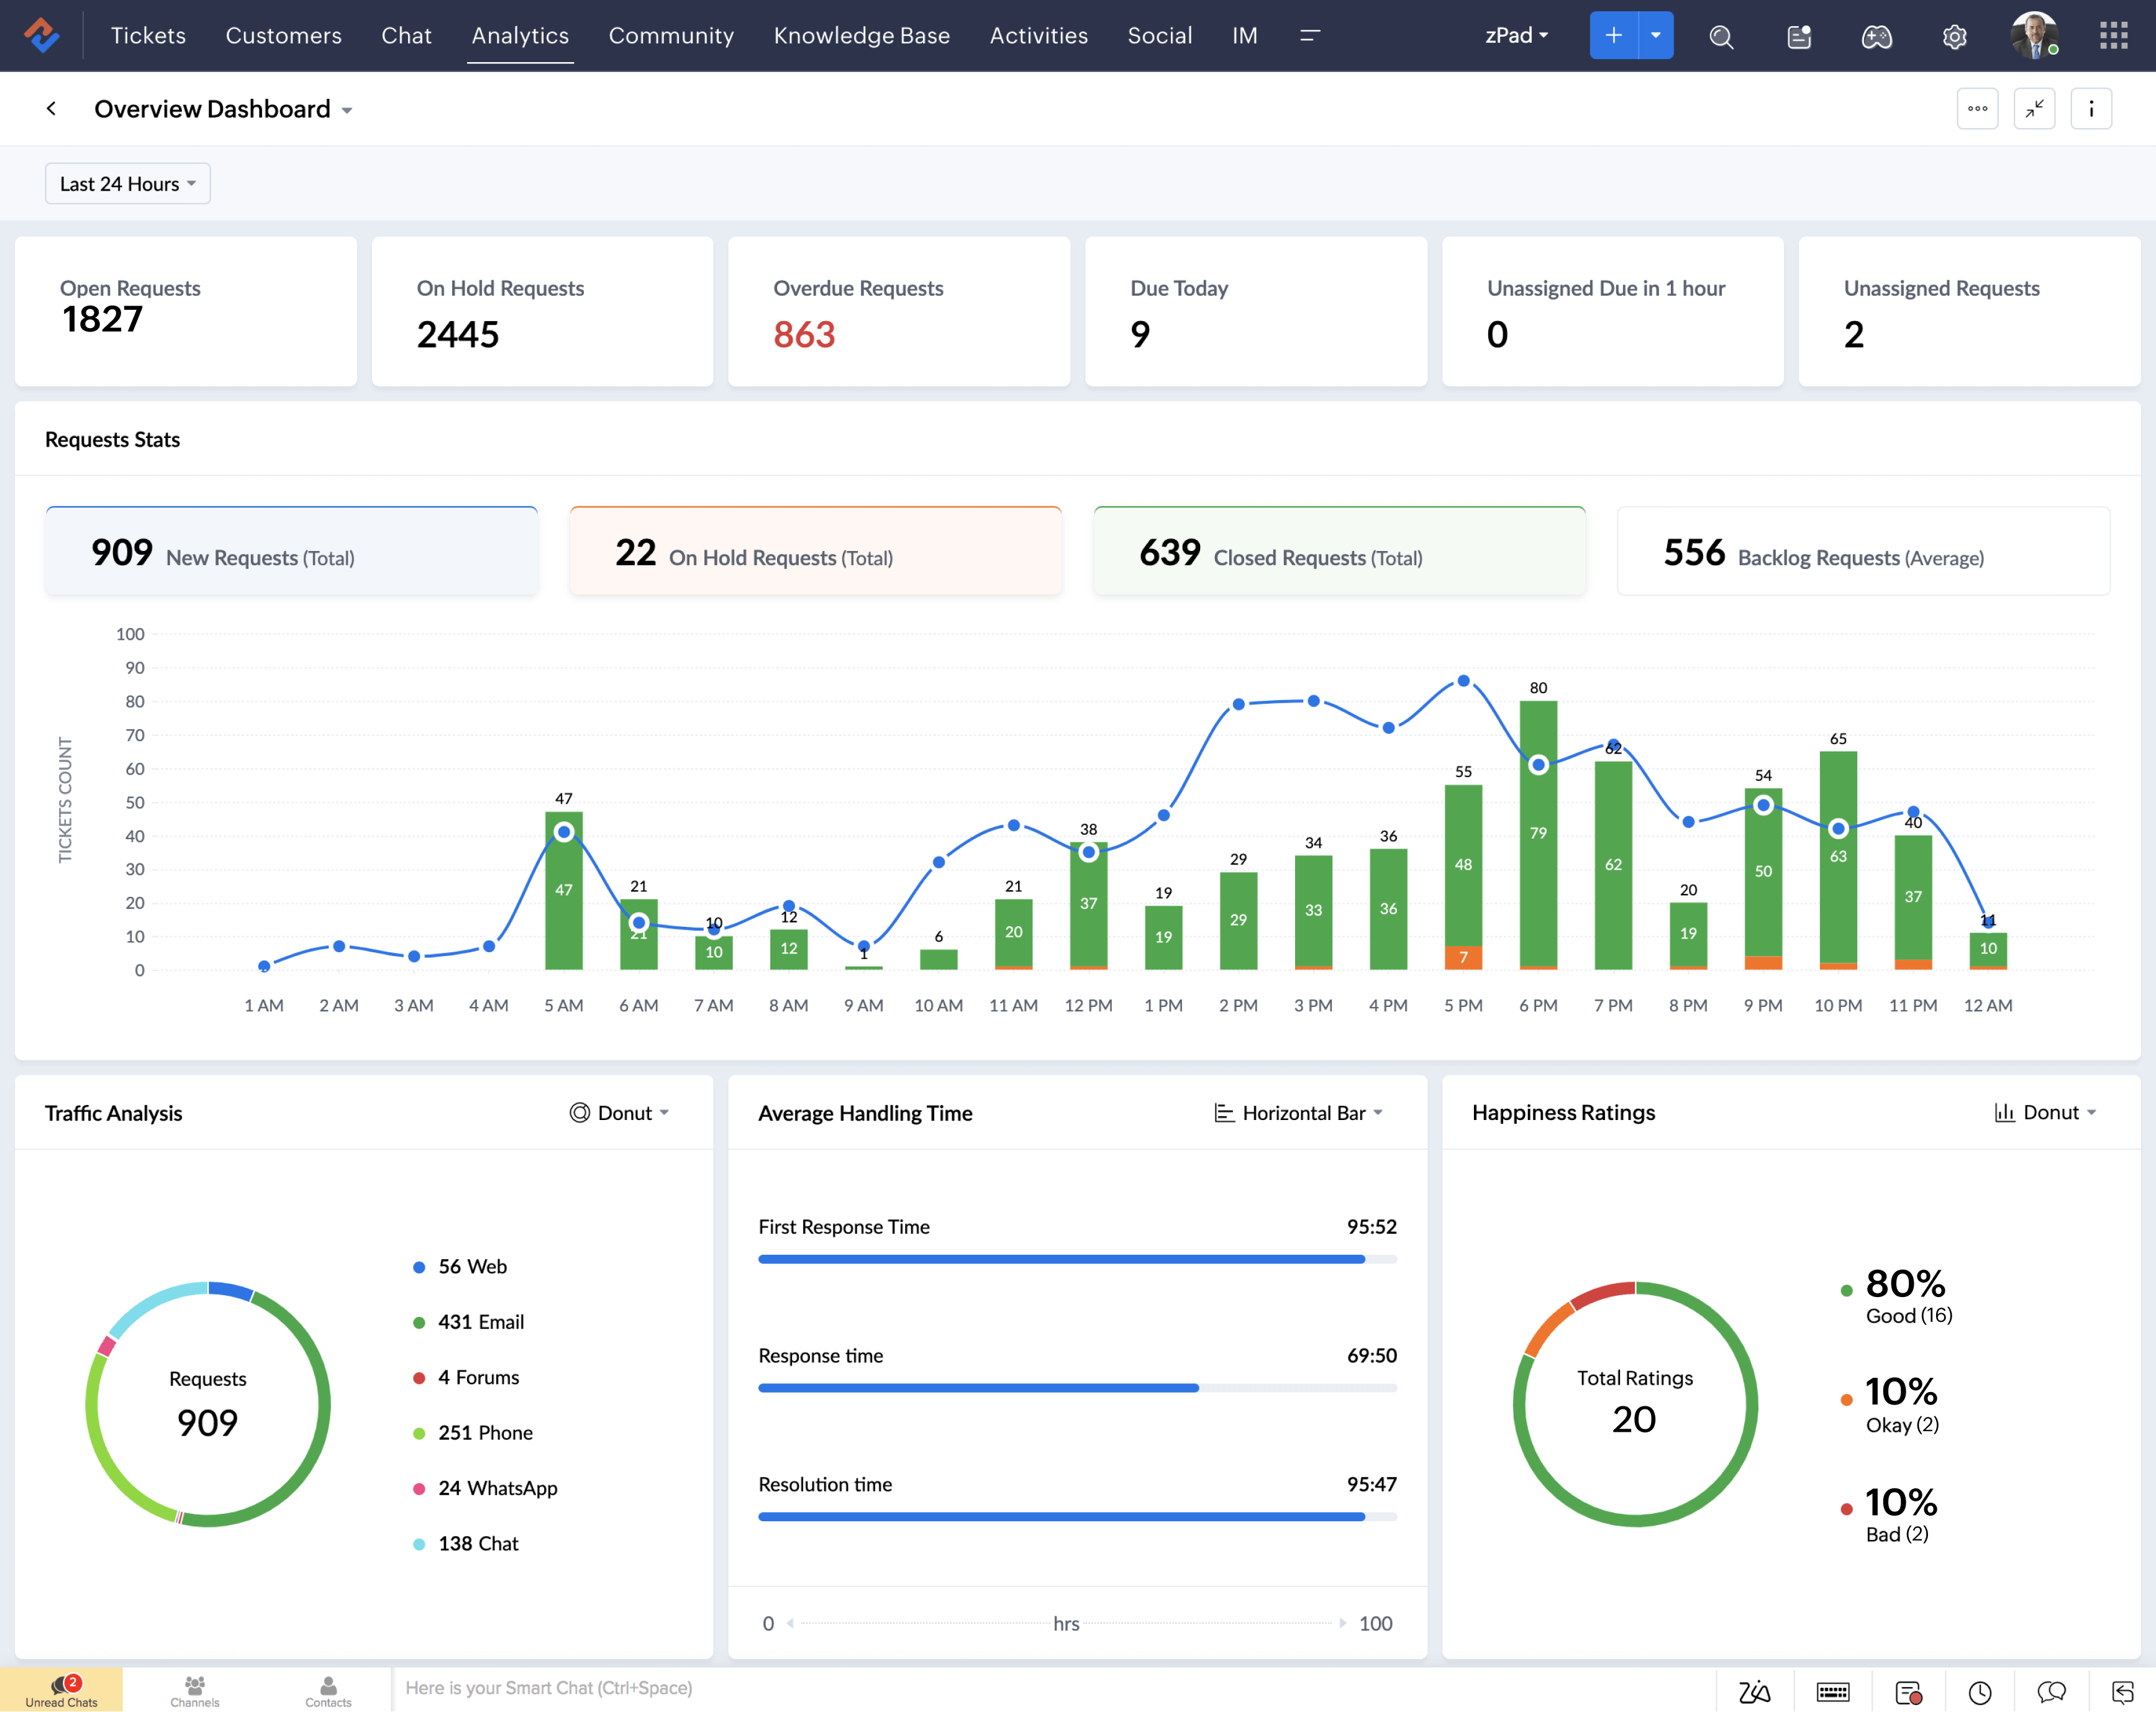
The big picture.
The ticket overview is the gateway to all the stats available to you. In a single screen, you get the big picture because all the metrics you want to see first are displayed here.
Welcome to your Headquarters.
This one's for the managers. Get all your stats together through the HQ, and see what your team is up to without having to switch between endless tabs.
Learn More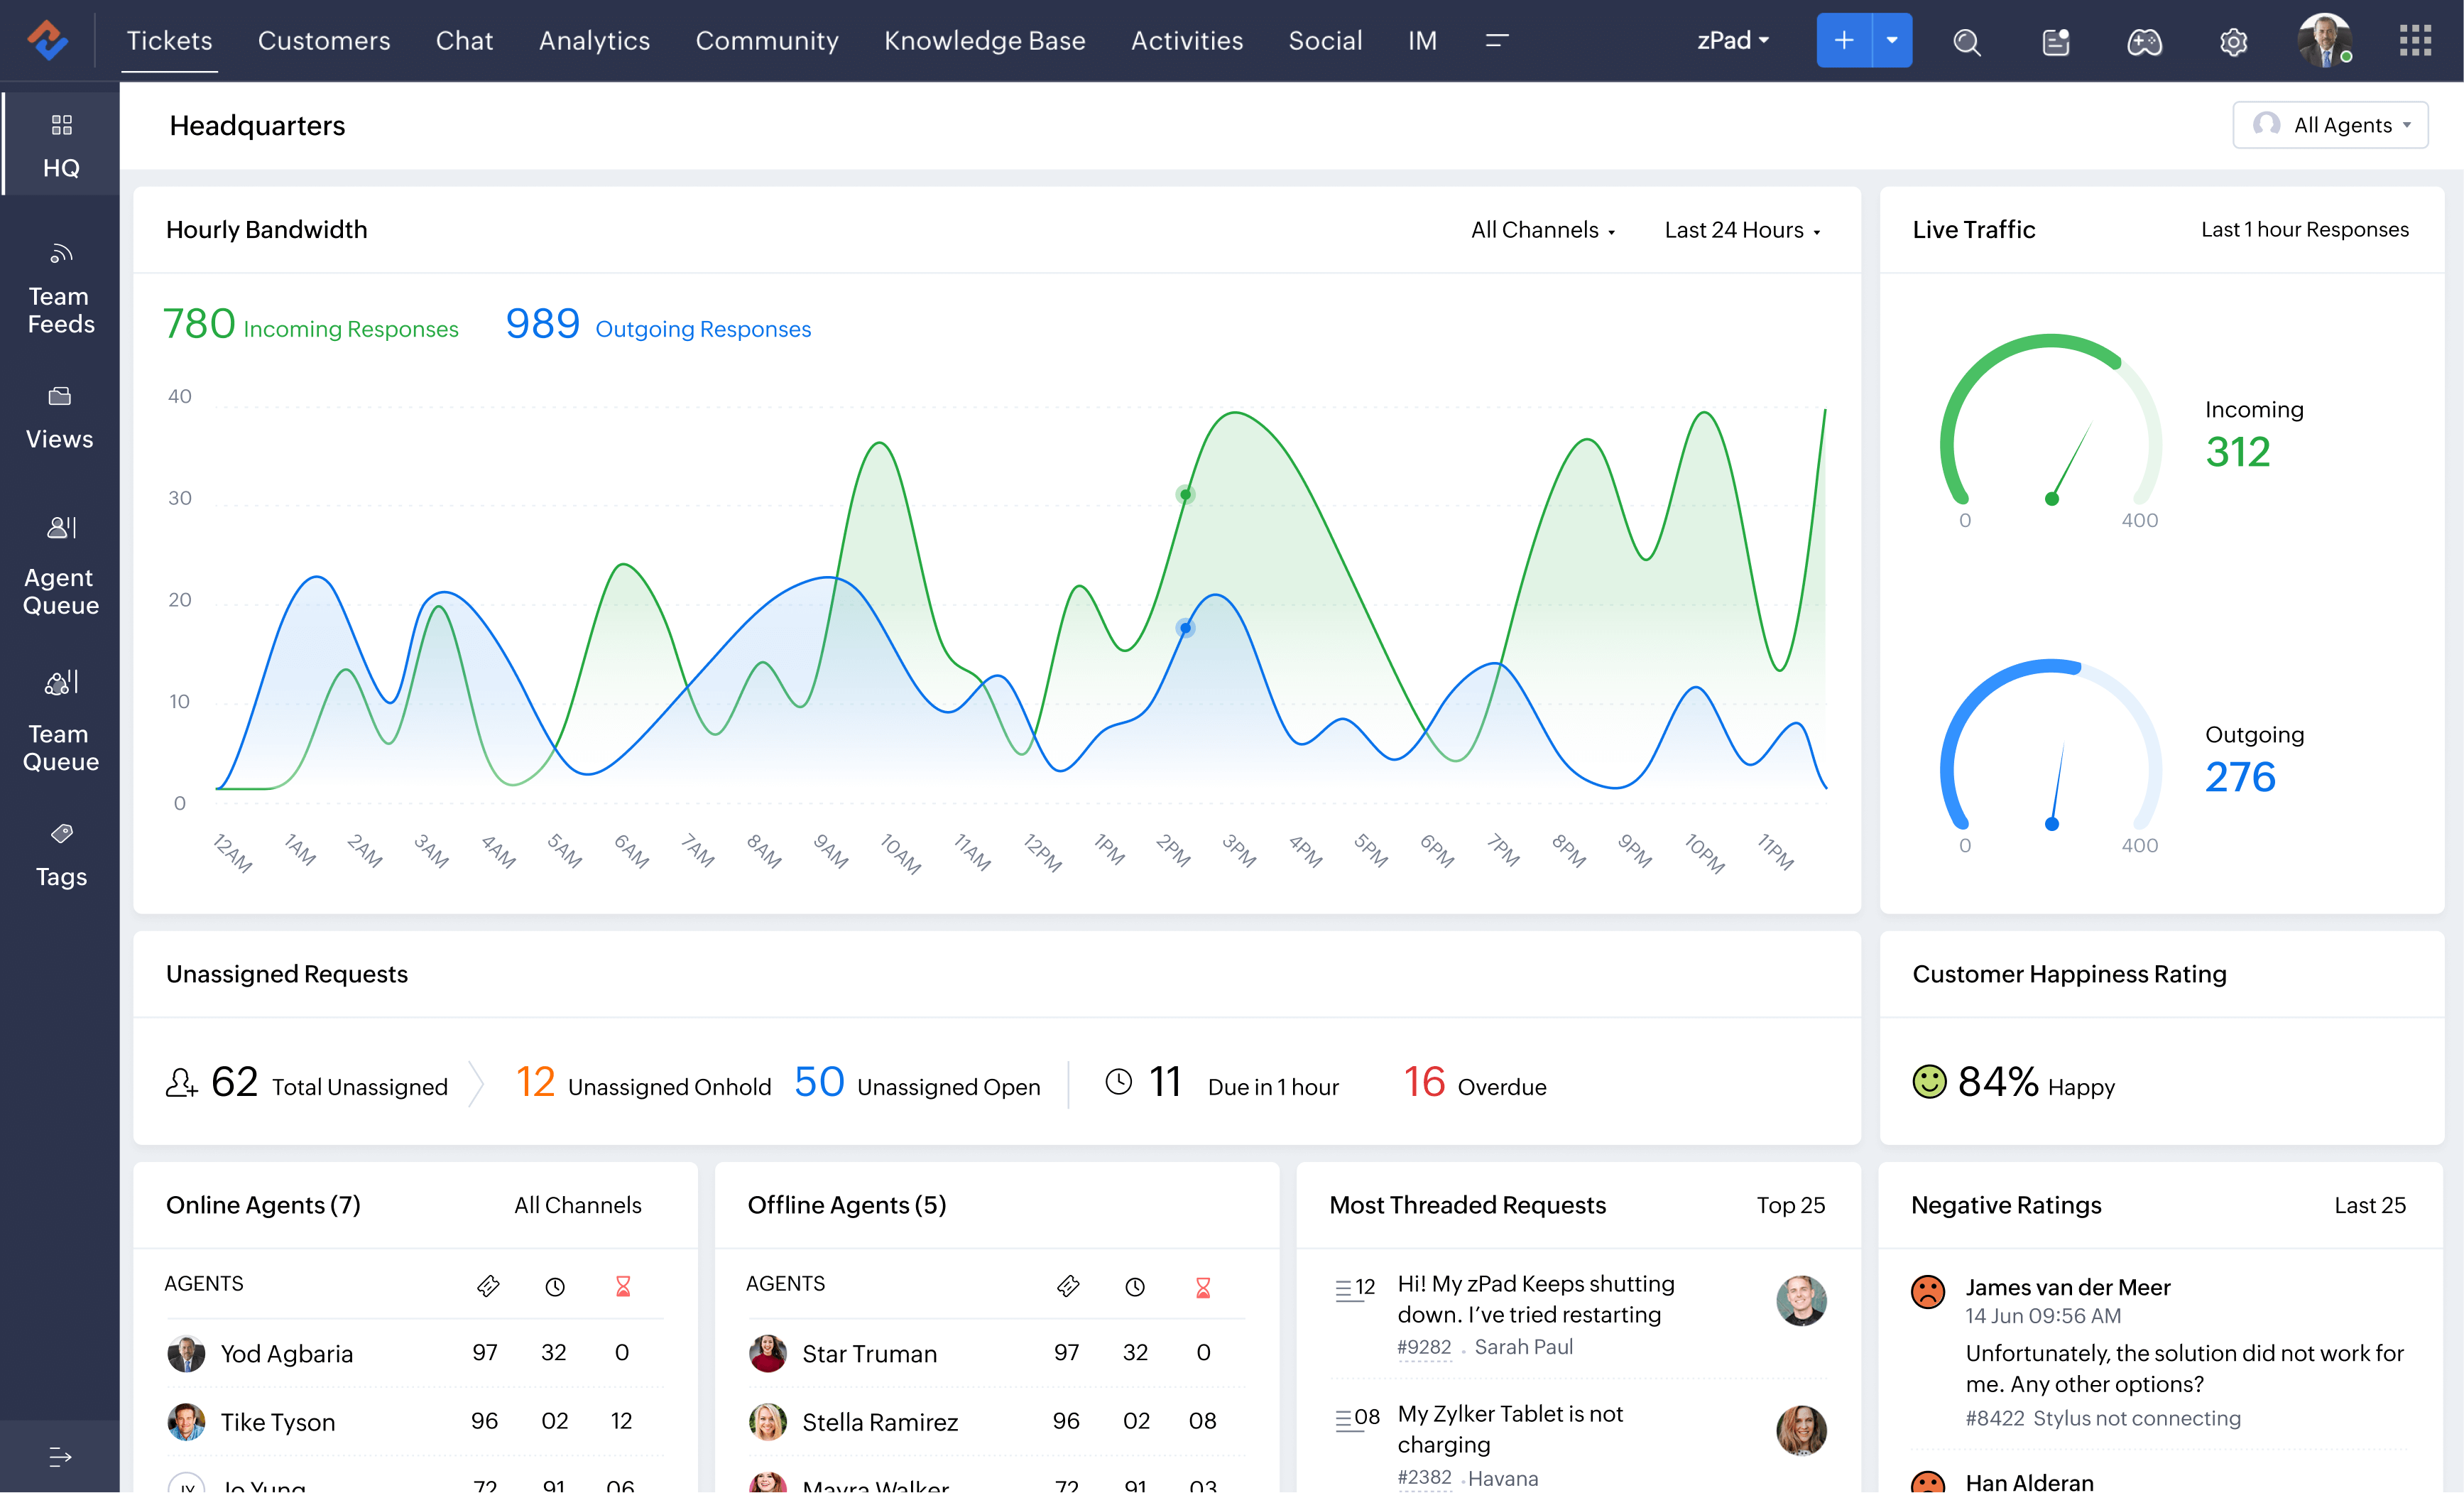
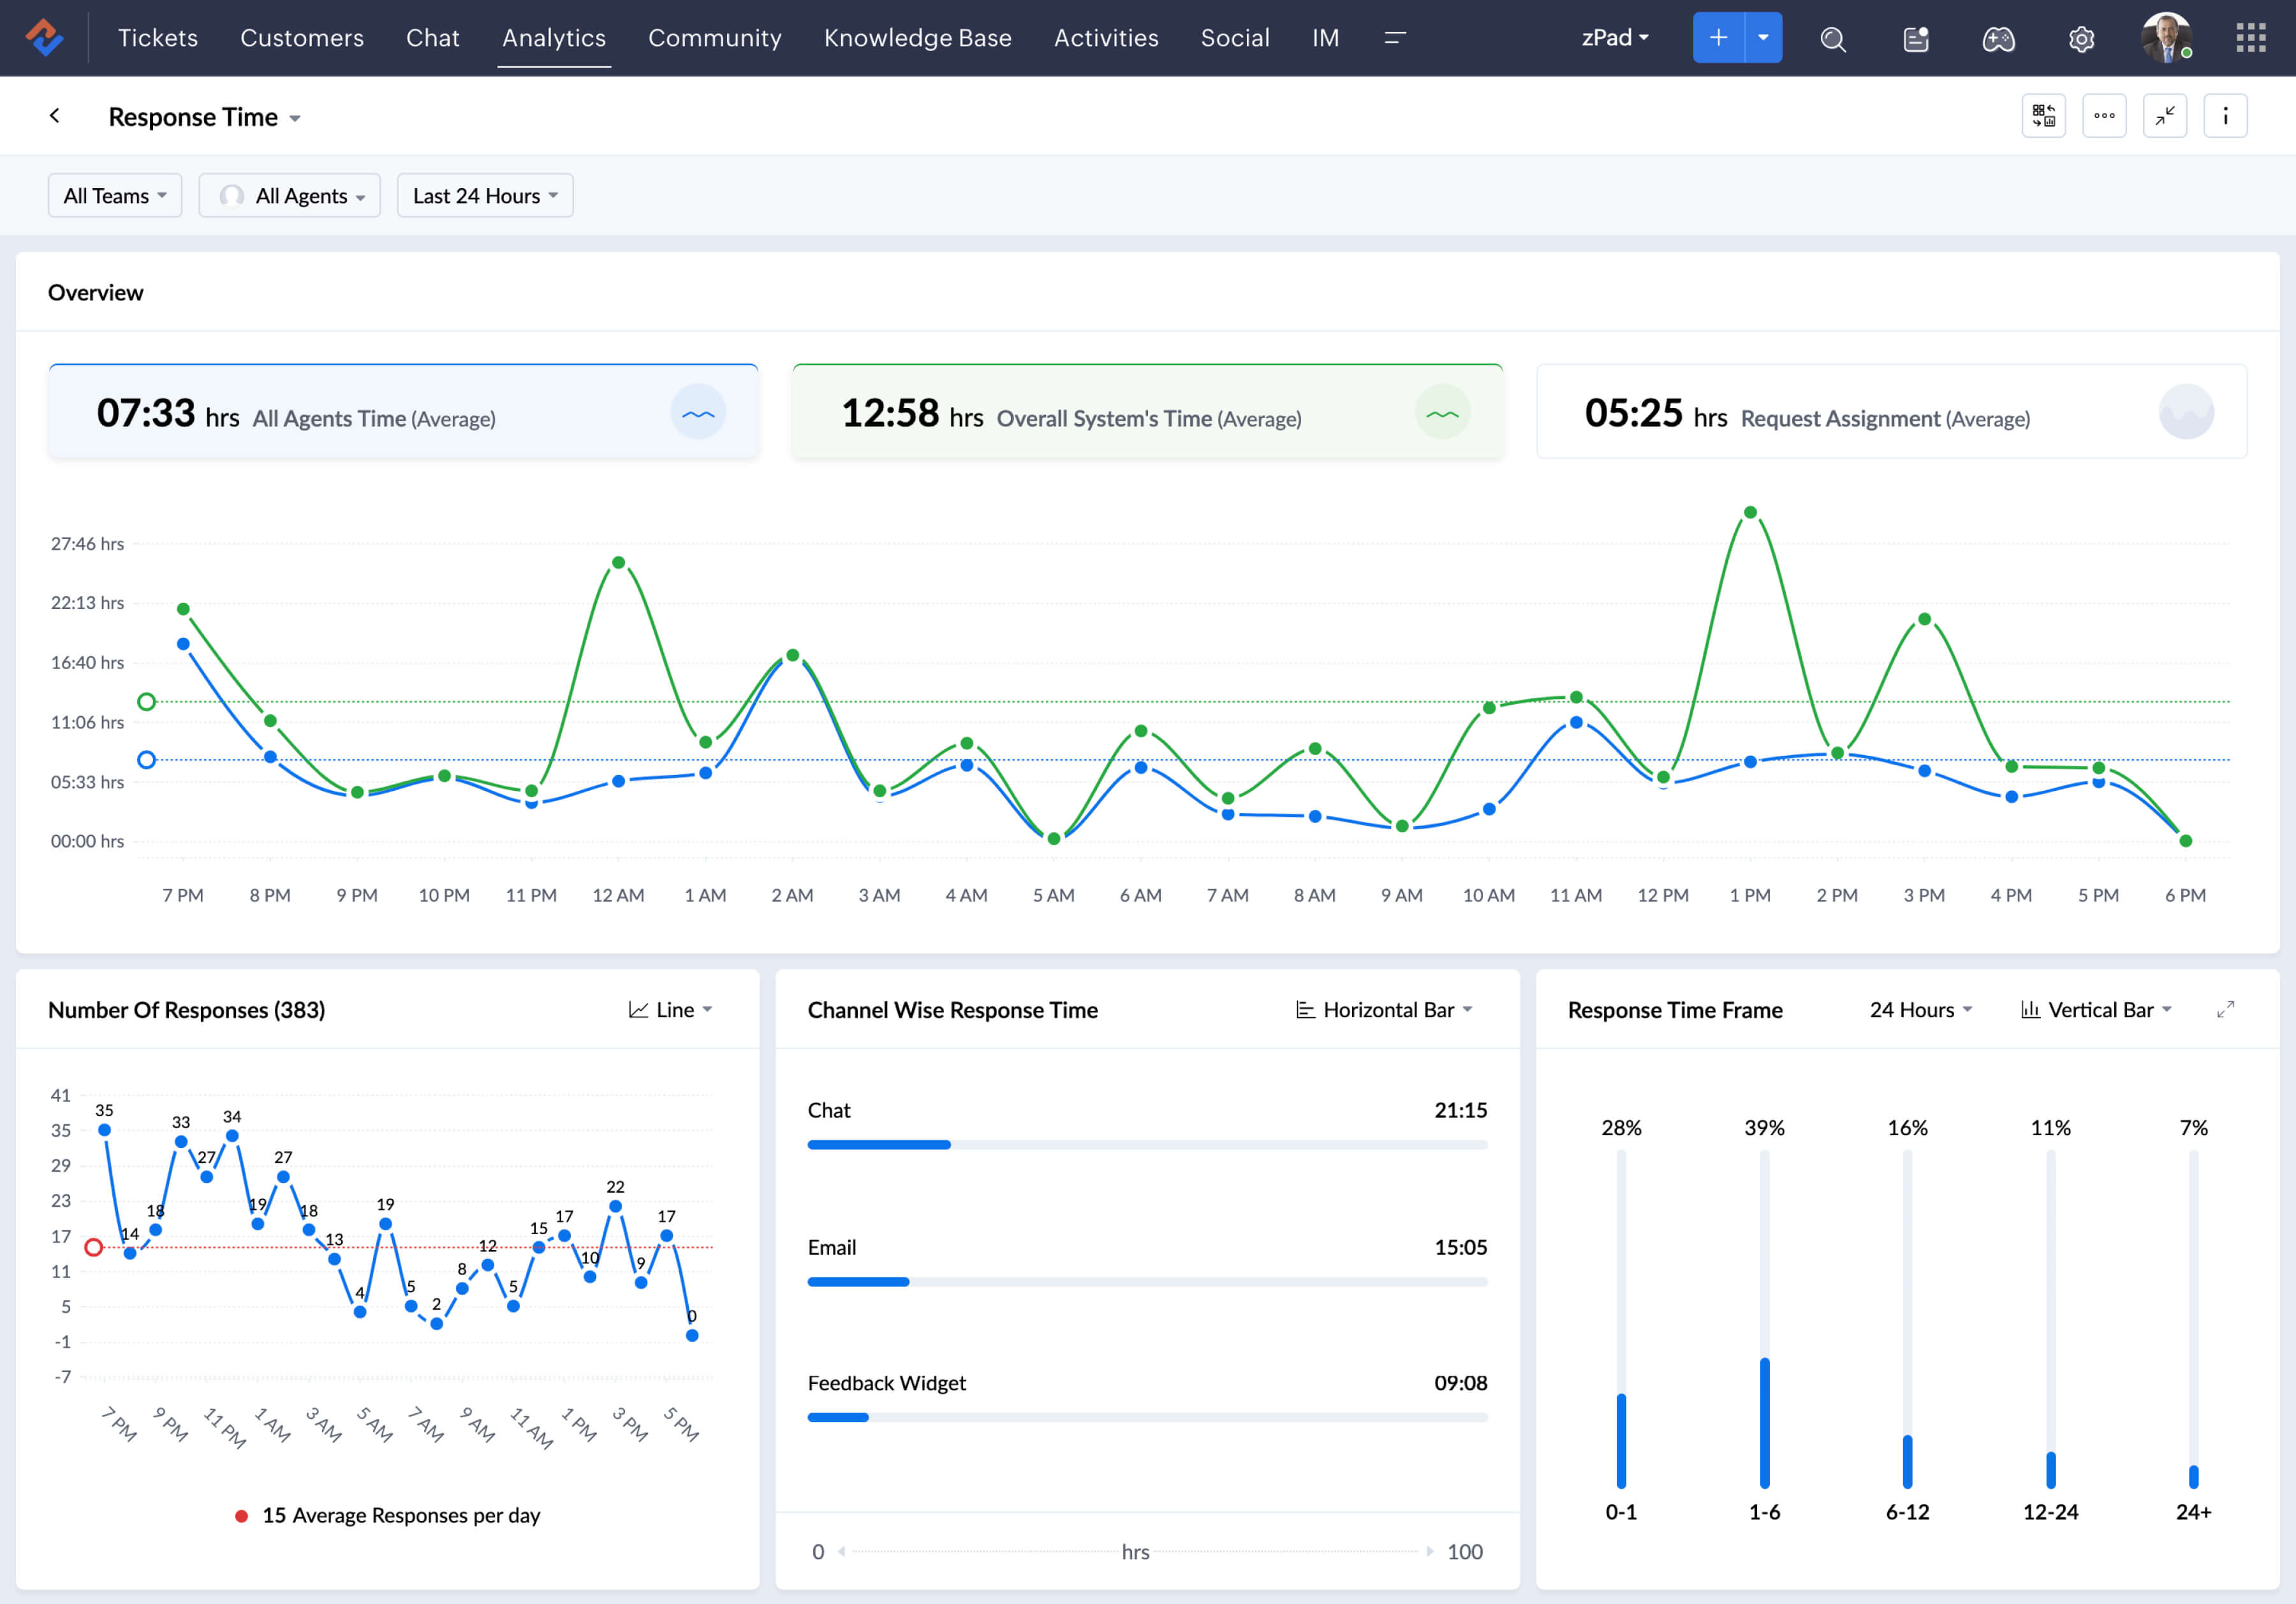
Because time is of essence.
Zoho Desk gives you time-based reports, which include data like First Response Time, Average Response Time and Average Resolution Time. These can be filtered based on date, channel, and agent.
Sometimes, keeping score can be good.
The Agent Scorecard tracks all agent performance parameters, such as average response time, customer happiness, ticket traffic, and expertise. All of this is displayed in a single screen, along with agent information and current availability.

Your data, your way.
With Advanced Analytics, get access to all the pre-defined dashboards in Zoho Analytics. This integration also lets you set up your own dashboards and share them with your team.
Enable better self-help.
The Solutions Dashboard gives you the number of customers who have accessed your solution articles. This data can help you and your team improve your articles.
Real-time analytics on the go.
Radar gives agents and managers a comprehensive overview of vital customer service stats from the convenience of their mobile phones. Critical areas such as ticket resolution time, customer happiness, live traffic, and individual agent stats can be monitored on a day-to-day basis, so exceptions are caught well in time.
Learn More