Working with a Tabular View
You can sort, filter, format, and freeze columns in a tabular view. In this section, we will discuss each of these options in detail.
- Sorting a Tabular View
- Dynamic Filtering
- Freeze Column
- Exporting a Tabular View
- Sharing a Tabular View
- Publishing a Tabular View
Sorting a Tabular View
In Zoho Analytics, by default, Tabular View data will be sorted in ascending order based on the data columns added to the Group by block shelf. Zoho Analytics allows you to sort these data columns to customize them to your needs.
The sort options in Tabular View are similar to the sort options available for tables.
To sort your Tabular View:
- Select the column to be sorted in your Tabular View.
- Click the Sort option at the top. Alternatively, you can also right-click on the required column and click Sort from the drop-down.
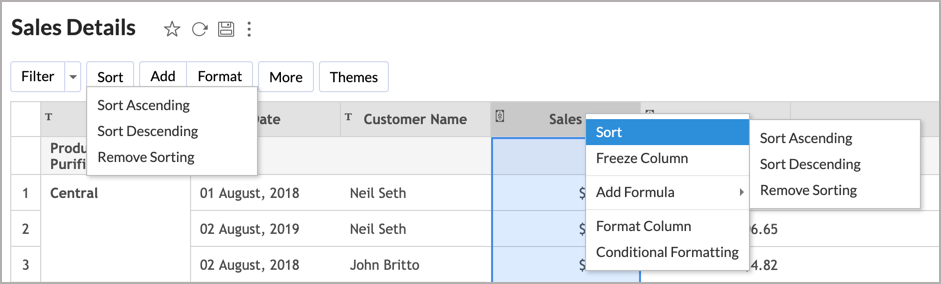
- You can choose to sort a Tabular View as given below:
- Sort Ascending - Sorts text data in ascending alphabetical order (A to Z), numbers from smallest to largest (0-9) and dates from oldest to latest.
- Sort Descending - Sorts text data in descending alphabetical order (Z to A), numbers from largest to smallest (9-0) and dates from latest to oldest.
- Remove Sorting - Clears the applied sorting.

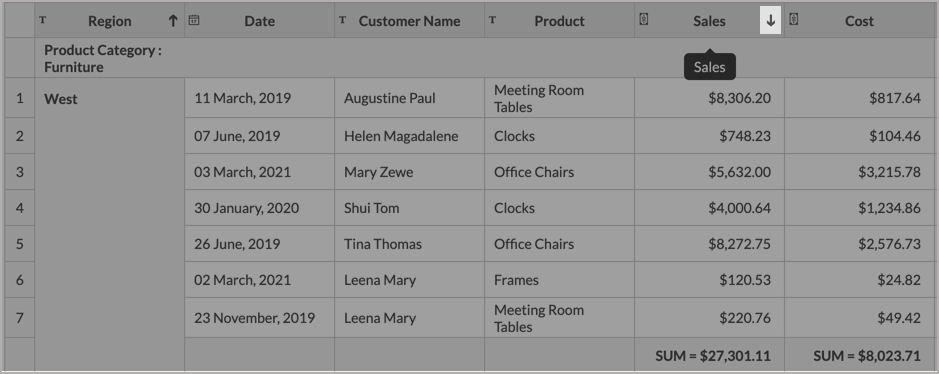
You can also sort the data columns in a Tabular View by clicking the Up/Down arrow that appears inline to your Column Name on mouse over.
Dynamic Filtering
Zoho Analytics allows you to dynamically filter the Tabular View to include/exclude only the needed data. As shown below, the filtering option varies based on the data type of the column being filtered.
The filter option in a Tabular View is similar to the one in a data table. Learn more.
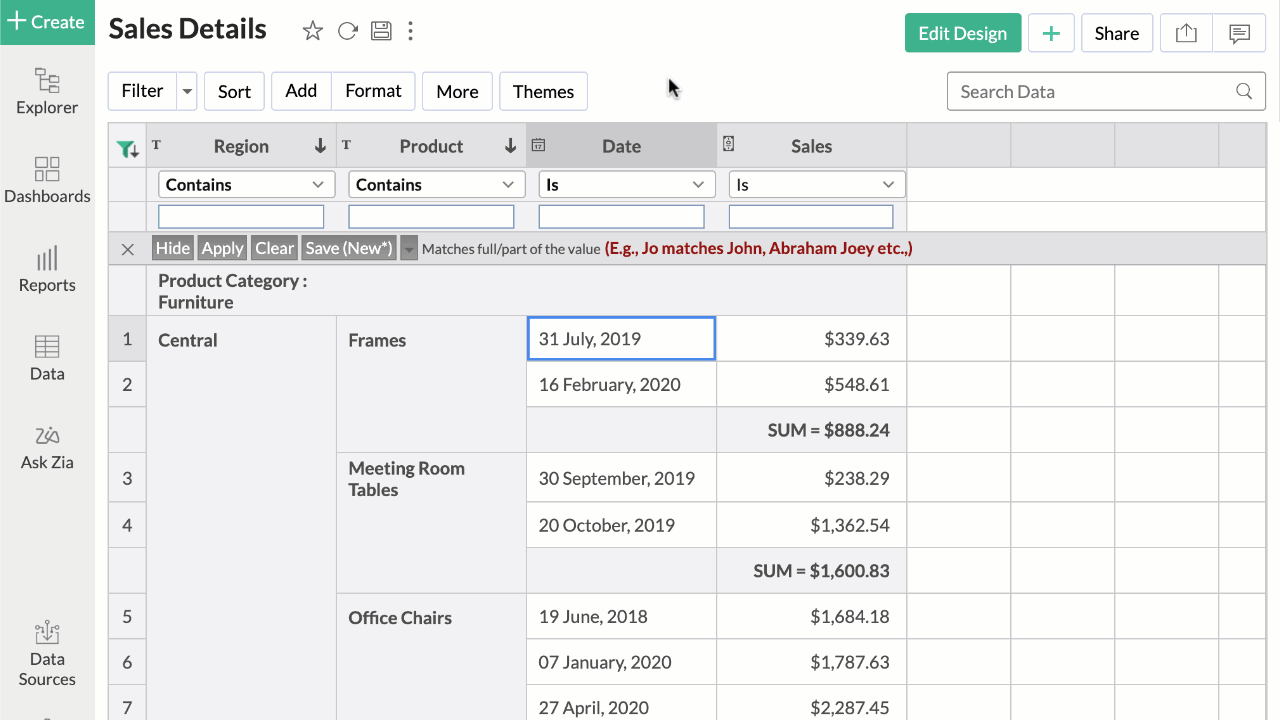
To apply a filter in a Tabular View:
- Click on the Filter button in the toolbar.
- The filtering options relevant to each data column will be displayed right below the column name. You can choose the appropriate filter operation and provide the filter value. Click Apply to apply the filter.
Here in this example, we will filter to display only the values corresponding to the Central region. - You can apply filters for more than one column and create AND filters. In the example, we will add two more filters - Current Year in Date and Sales value Greater than $500.
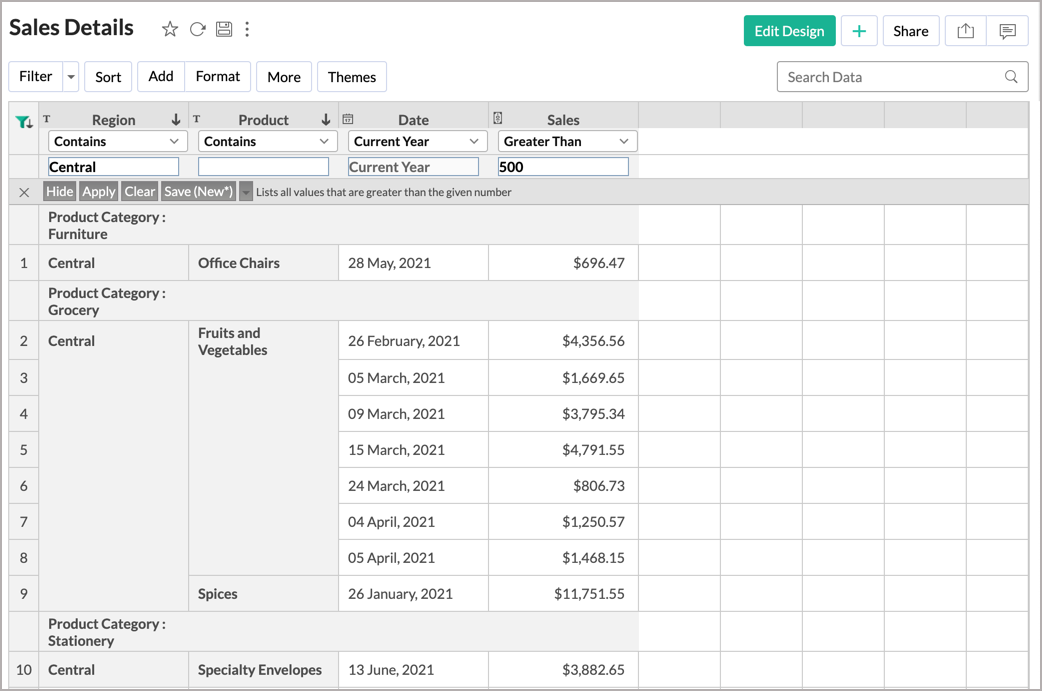
- Click Apply to apply the filters.
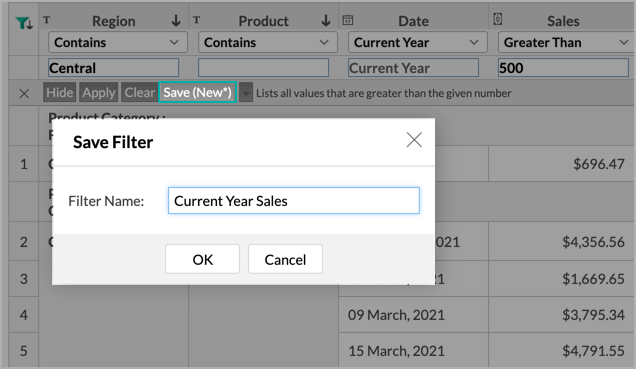
- After adding the required filters, click the Save (New*) button to save the created filter. Any number of filters saved will be available inside the filters option.


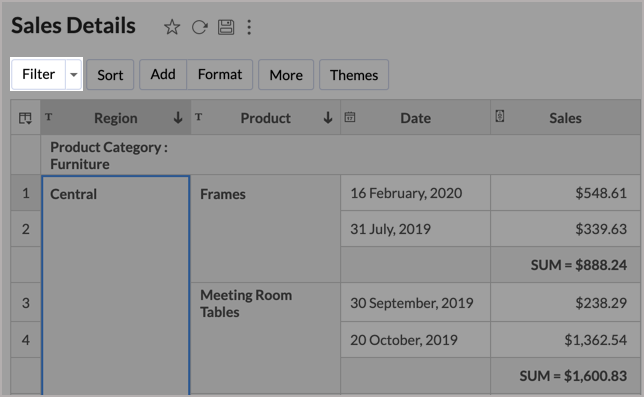
You can also filter to include/exclude a particular data value by following the below steps:
- Right-click on the required data cell.
- In the menu that appears, click Filter including this value/Filter excluding this value.
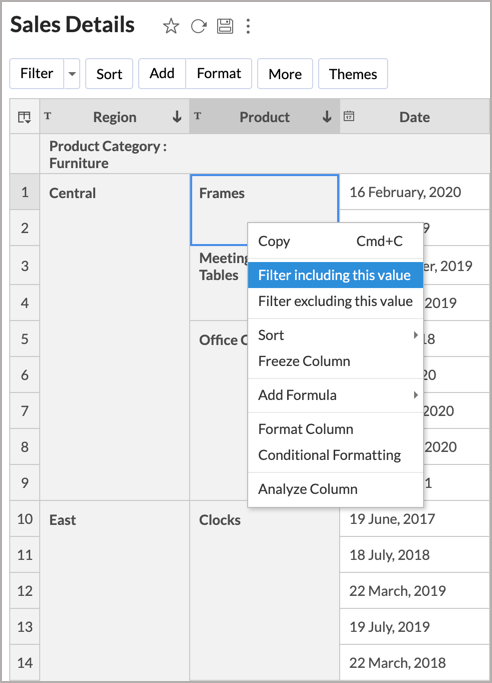

This will add the filtering pane below the column names. You can then add the required filters.
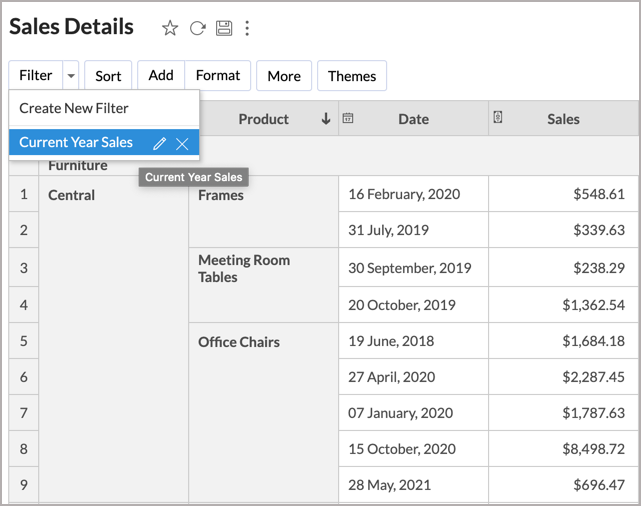
Editing the saved Dynamic Filters
All the saved dynamic filters will be listed under the Filters menu. You can edit them by clicking the Edit icon that appears on mouse over the filter name.
To delete a filter, click the Filter menu > Delete icon inline to the filter name.
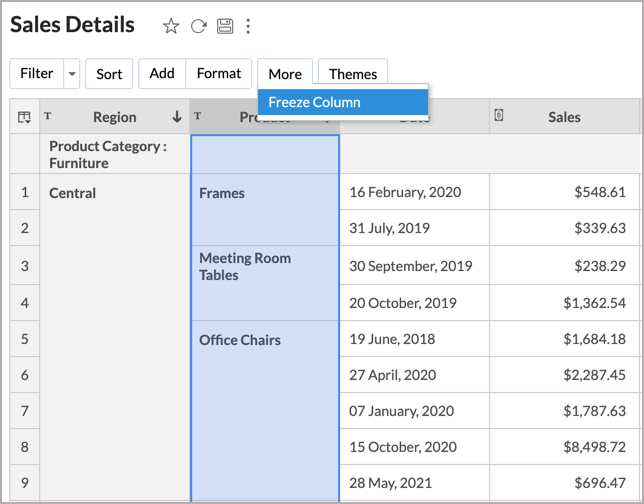
Freeze Column
The Freeze Column option allows you to pin columns in the report. These pined columns will not move while scrolling the columns horizontally and will stay static.
The Freeze columns will be displayed at the beginning of the Tabular view, one after the other.
To freeze a column in Tabular View:
- Select the column and click More > Freeze Column.
Alternatively, you can also right-click a column and click Freeze Column from the drop-down.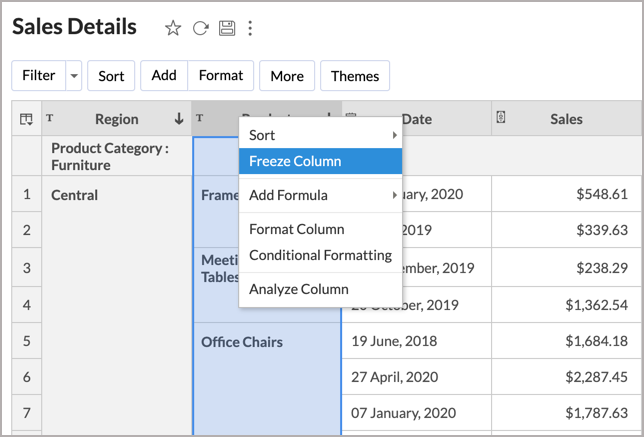
- To Unfreeze the column click the pin icon on the top right corner of the column.


Exporting a Tabular View
Zoho Analytics allows you to export the Tabular View that you have created into various file formats like CSV, PDF, XLS or HTML.
To Export a Tabular View:
- Open the Tabular View that you would like to export.
- Click the Export icon in the toolbar.
- Select from the following export options:
- CSV - Exports the underlying data of the Tabular View as a Comma Separated Value (CSV) file.
- PDF - Exports the view in Portable Document Format (PDF) file format.
- HTML - Exports the view in HTML file format.
- Excel (XLS) - Exports the underlying data of the Tabular View as a Excel file.
- As Zoho Sheet - Copies the underlying data of the Tabular View into a Zoho Sheet file.
- As Template - Creates a template of the tabular view that can be used to easily recreate this tabular view in other workspaces or accounts.
- In the Export as window that opens, provide the necessary inputs. Read more.
- Click the Export button at the bottom.
Sharing a Tabular View
In Zoho Analytics you can easily share the Tabular View, which you have created, to other users.
To Share a Tabular View:
- Open the Tabular View that you wish to share.
- Click the Share button > Share this View in the toolbar.
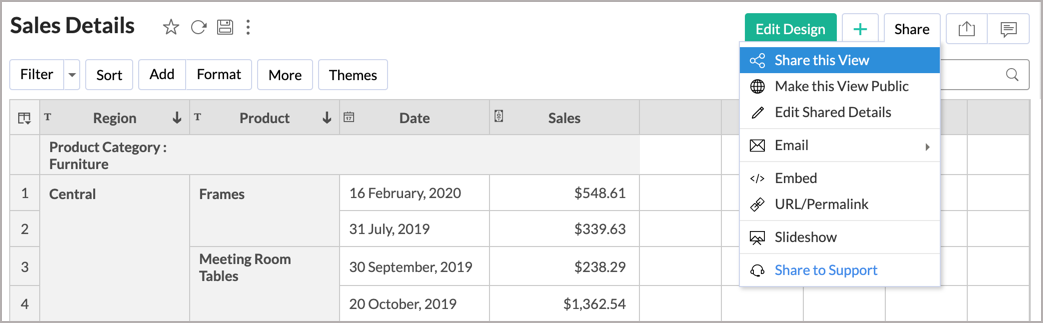
- In the Share the view(s) to new Users / Groups dialog that opens, provide the following inputs:
- Specify the Email Addresses of the users to whom you wish to share
- Grant the required permissions to the users for the views selected
- Specify the Filter Criteria if needed
- Customize the invitation mail
- Click Share.

Publishing a Tabular View
Zoho Analytics allows you to publish the Tabular View that you have created, into your websites/blogs. Zoho Analytics also allows you to set and control the access privileges provided to the users who access the Tabular View. This option will be enabled only for Organization, Account, and Workspace Administrators. Refer Publishing Options to know how to publish a Tabular View.