Tabular View
A Tabular View as the name implies is a simple, yet powerful table-like (or spreadsheet-like) report that you can create over your data tables in Zoho Analytics. Though lightweight, the Tabular View is one of the powerful reporting options offered by Zoho Analytics.
Tabular View offers a variety of options that help you summarize, structure, group, and list your data. It also comes with an advanced filtering option that allows you to filter the required data in multiple ways. The dynamic user filters option helps the viewers of the report to interact and filter data based on their needs.
The below snapshot illustrates the basic layout of a Tabular View:
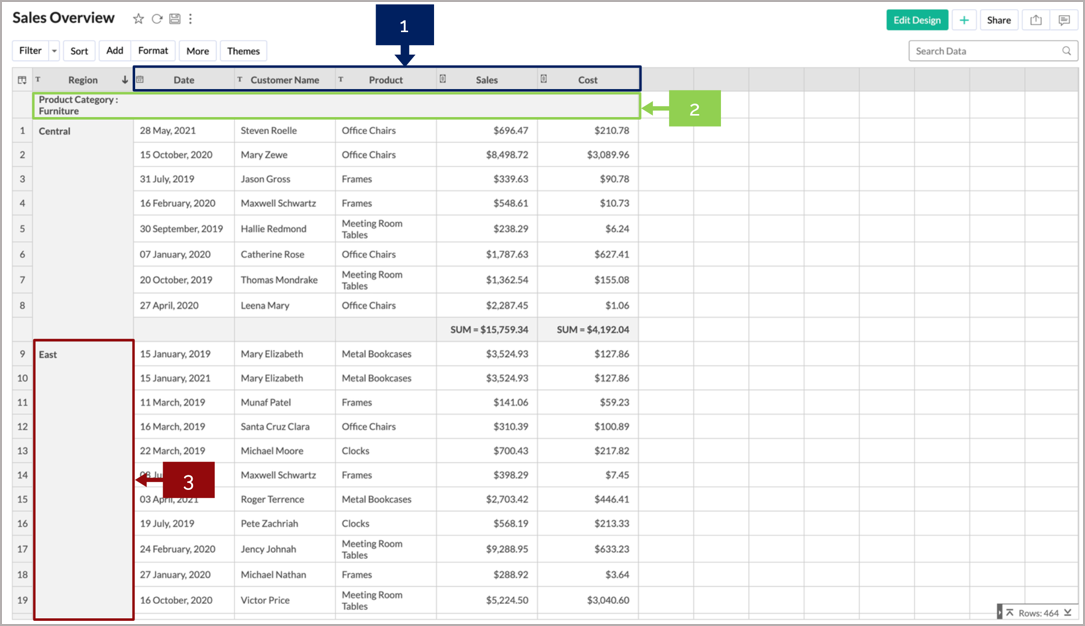
- Columns
- Group by section
- Group by block
In this chapter, we will discuss about: