Zia Insights
The Zia Insights feature analyzes reports and dashboards and automatically provides actionable insights on the visualization. Rather than digging into the report and analyzing a visualization manually, you can use the Zia Insights option to derive insightful information immediately.
Invoking Zia Insights
Zia Insights can be invoked either from individual reports or from the reports that are embedded inside dashboards.
From a report
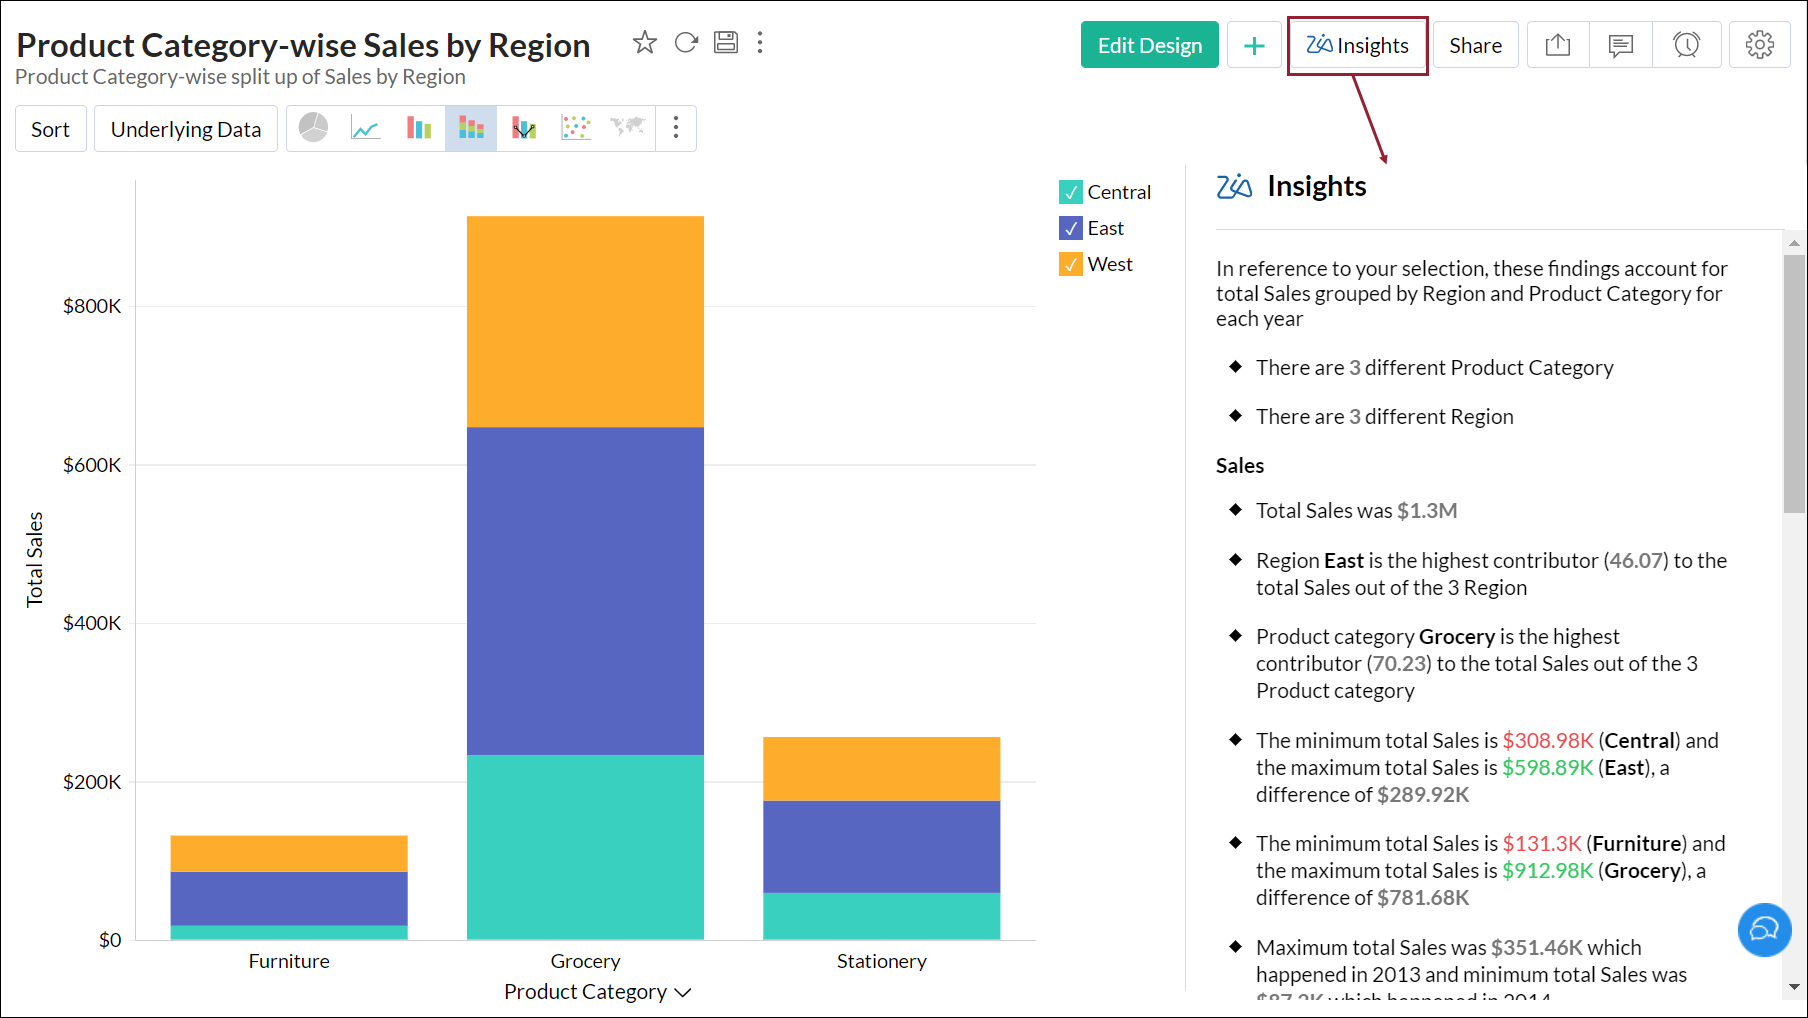
To access immediate insights on a report, open the required report and click the Zia Insights button on the top right corner. A popup appears displaying the required information.
From a dashboard
To access insights on a report embedded in a dashboard, open the dashboard, expand the required report and click the Zia icon on the top right corner. A popup appears, displaying the detailed insights on the selected report.

Types of Insights
Predictive Analysis
Predicts the future outcomes and performances based on past data.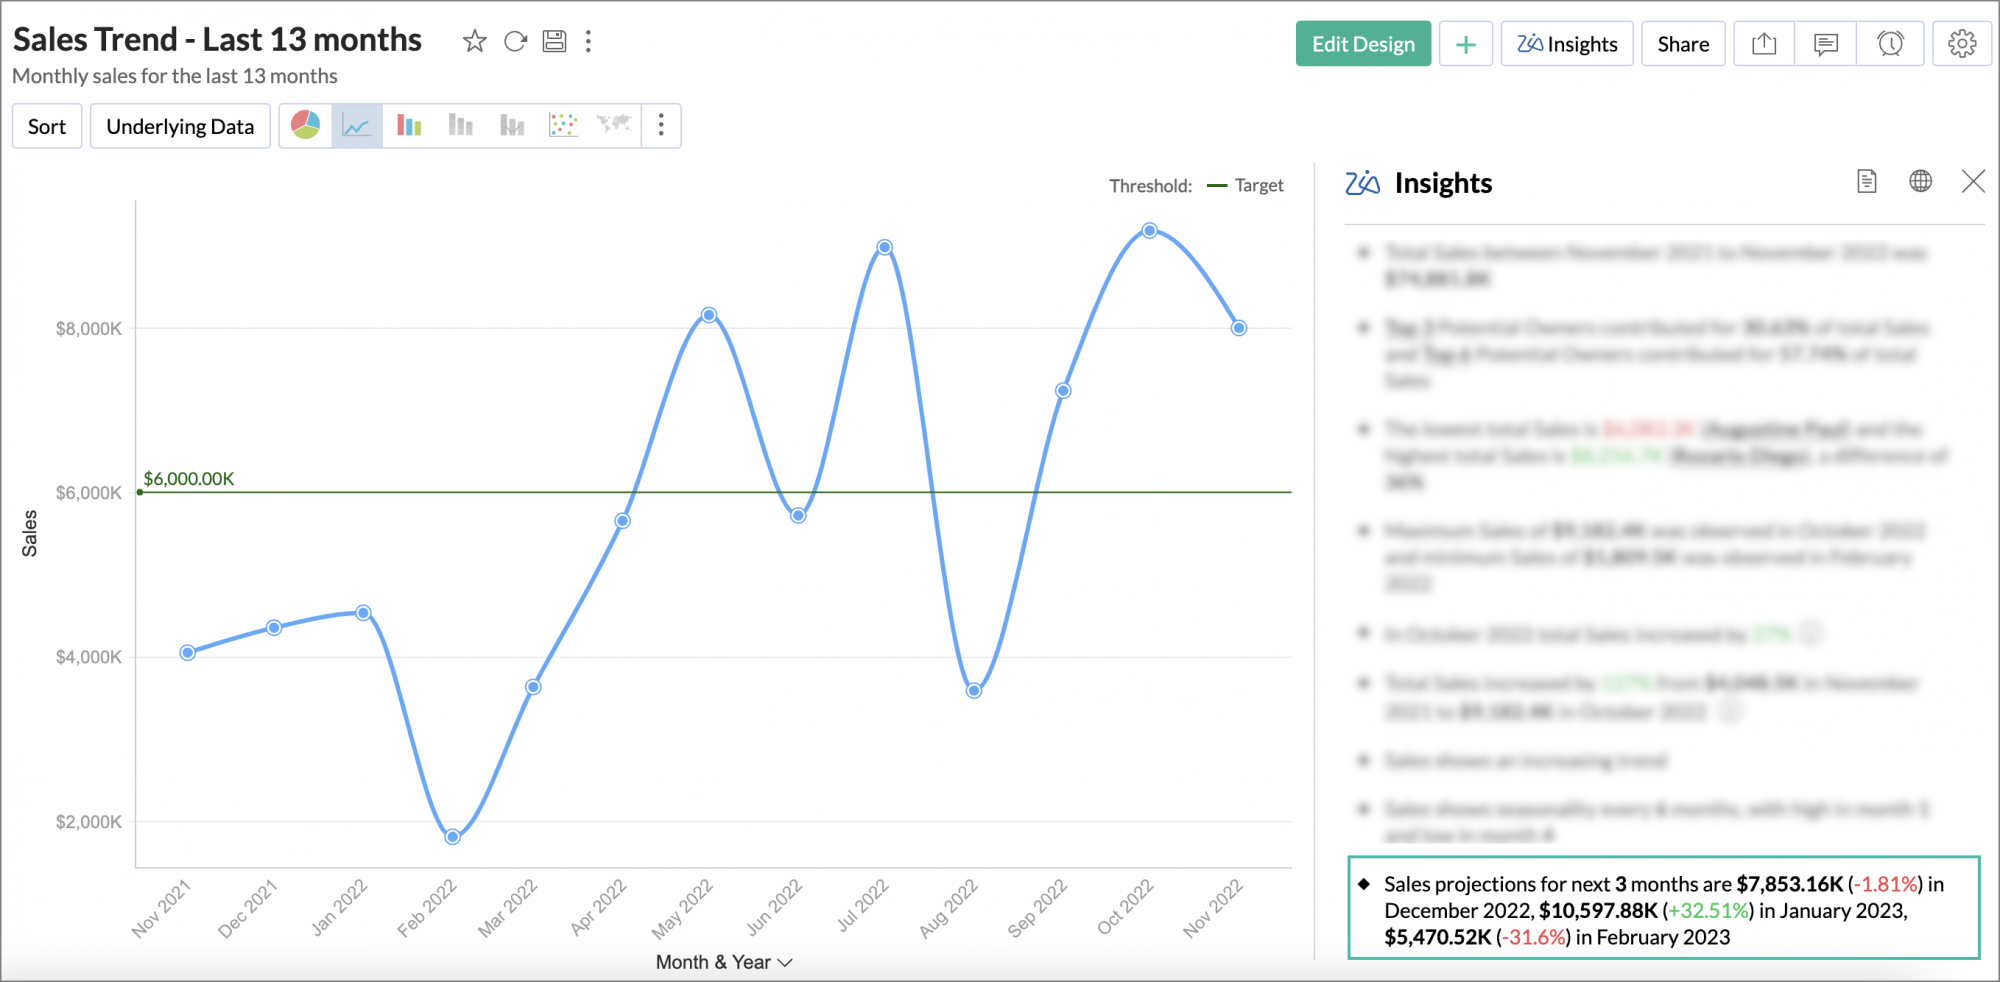
Dynamic Insights based on Legend
Zia Insights provides insights dynamically based on the selection made in the legend filter to help you dig deeper and derive insightful information based on the area or category of interest as per the selection.
Explain Data - Zia Insights
The Explain Data - Zia Insights feature provides information related to the selected data point in the report. This helps in identifying significant changes or anomalies in the data.
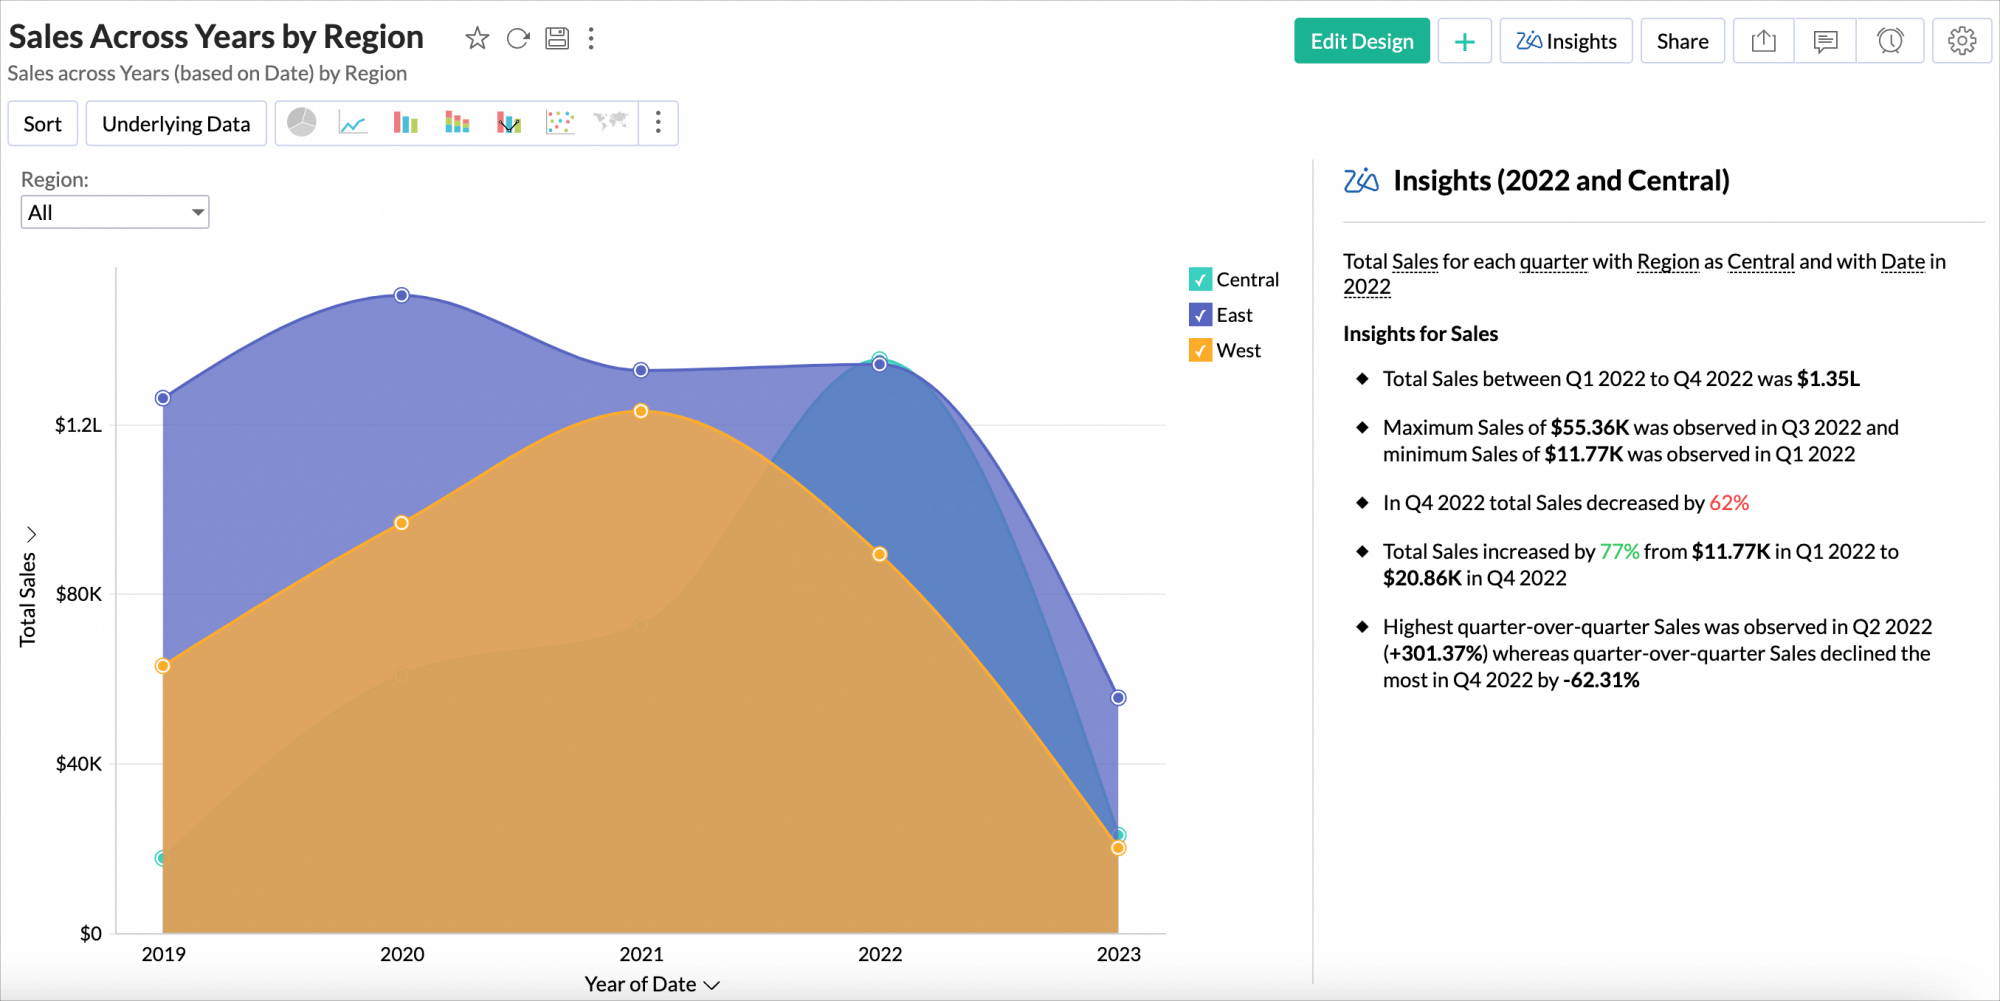
For example, for a chart that displays the sales across the years by region, enabling Explain Data - Zia Insights for the year 2022 will display insights on sales based on the quarterly breakdown of sales for that year.
Invoking Explain Data - Zia Insights
- Open the report in the view mode.
Click any data point in the report and select Explain Data - Zia Insights.
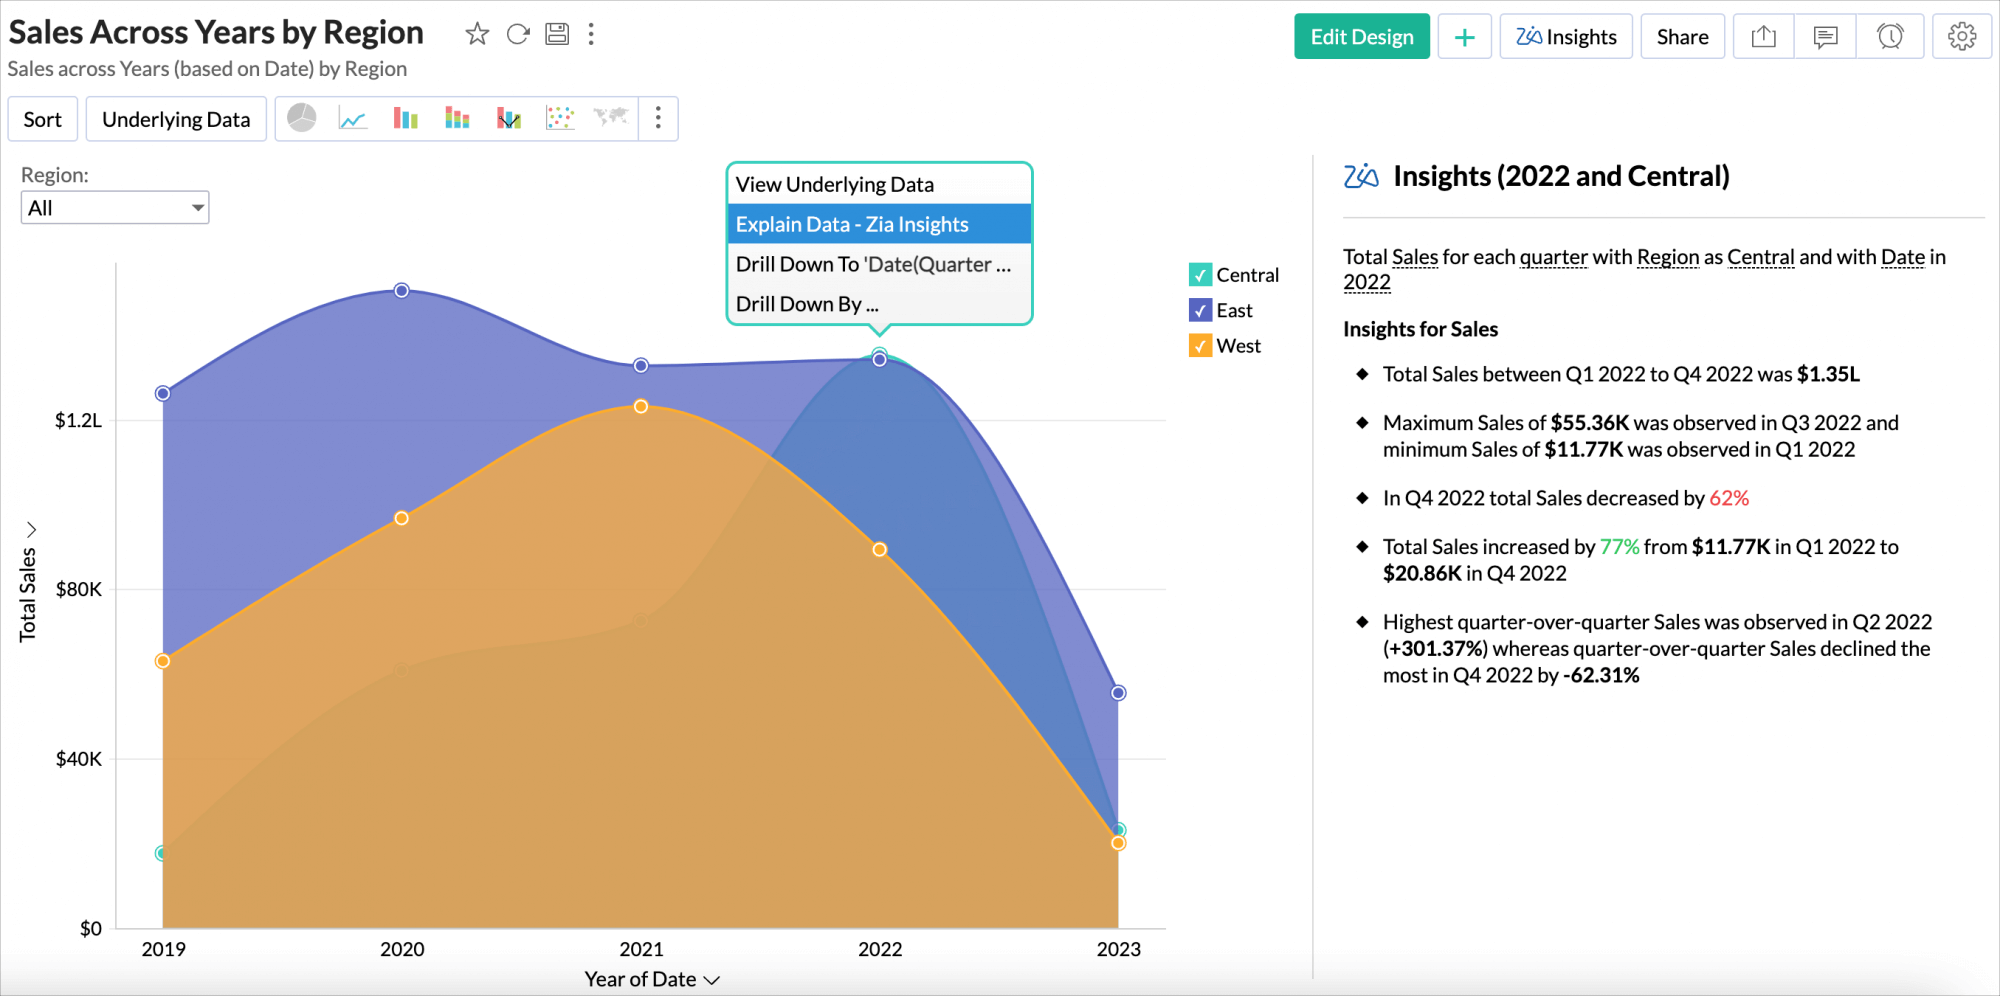
- Insights for the selected data point will be displayed on the right.
